

Ethereum has extended its weekly decline as a multi-billion-dollar options expiry, institutional selling, and a hawkish Federal Reserve outlook have driven the token back toward its key $1,500 support.
Summary
- Ethereum has fallen 14.4% from its June 22 high as ETF outflows, a $10.63 billion options expiry, and macro pressure fueled the selloff.
- Technical indicators show bears remain in control, with $1,500 acting as the key support and $1,750 the first major recovery level.
- CryptoQuant data show major Ethereum whale cohorts have slipped into unrealized losses, adding to concerns over near-term market sentiment.
According to data from crypto.news, Ethereum (ETH) fell about 7% to an intraday low of $1,517 on June 26 before stabilizing around $1,550 at press time. The asset has dropped nearly 14.4% from its June 22 high of $1,773.
The selloff gathered pace after Ethereum lost its 200-day moving average near $1,668, triggering a wave of leveraged long liquidations.
Meanwhile, U.S. spot Ethereum ETFs recorded roughly $260 million in net outflows this week, a sharp jump from the previous weeks, as institutional investors reduced exposure ahead of expectations for three Federal Reserve rate hikes this year.
Additional pressure emerged after the Ethereum Foundation announced a 20% workforce reduction and a 40% cut to its operating budget. The restructuring raised fresh questions about the network’s development pace and funding outlook while traders were already navigating heightened volatility around the $11 billion options expiry.
Ethereum’s $1,500 support has become the market’s main test
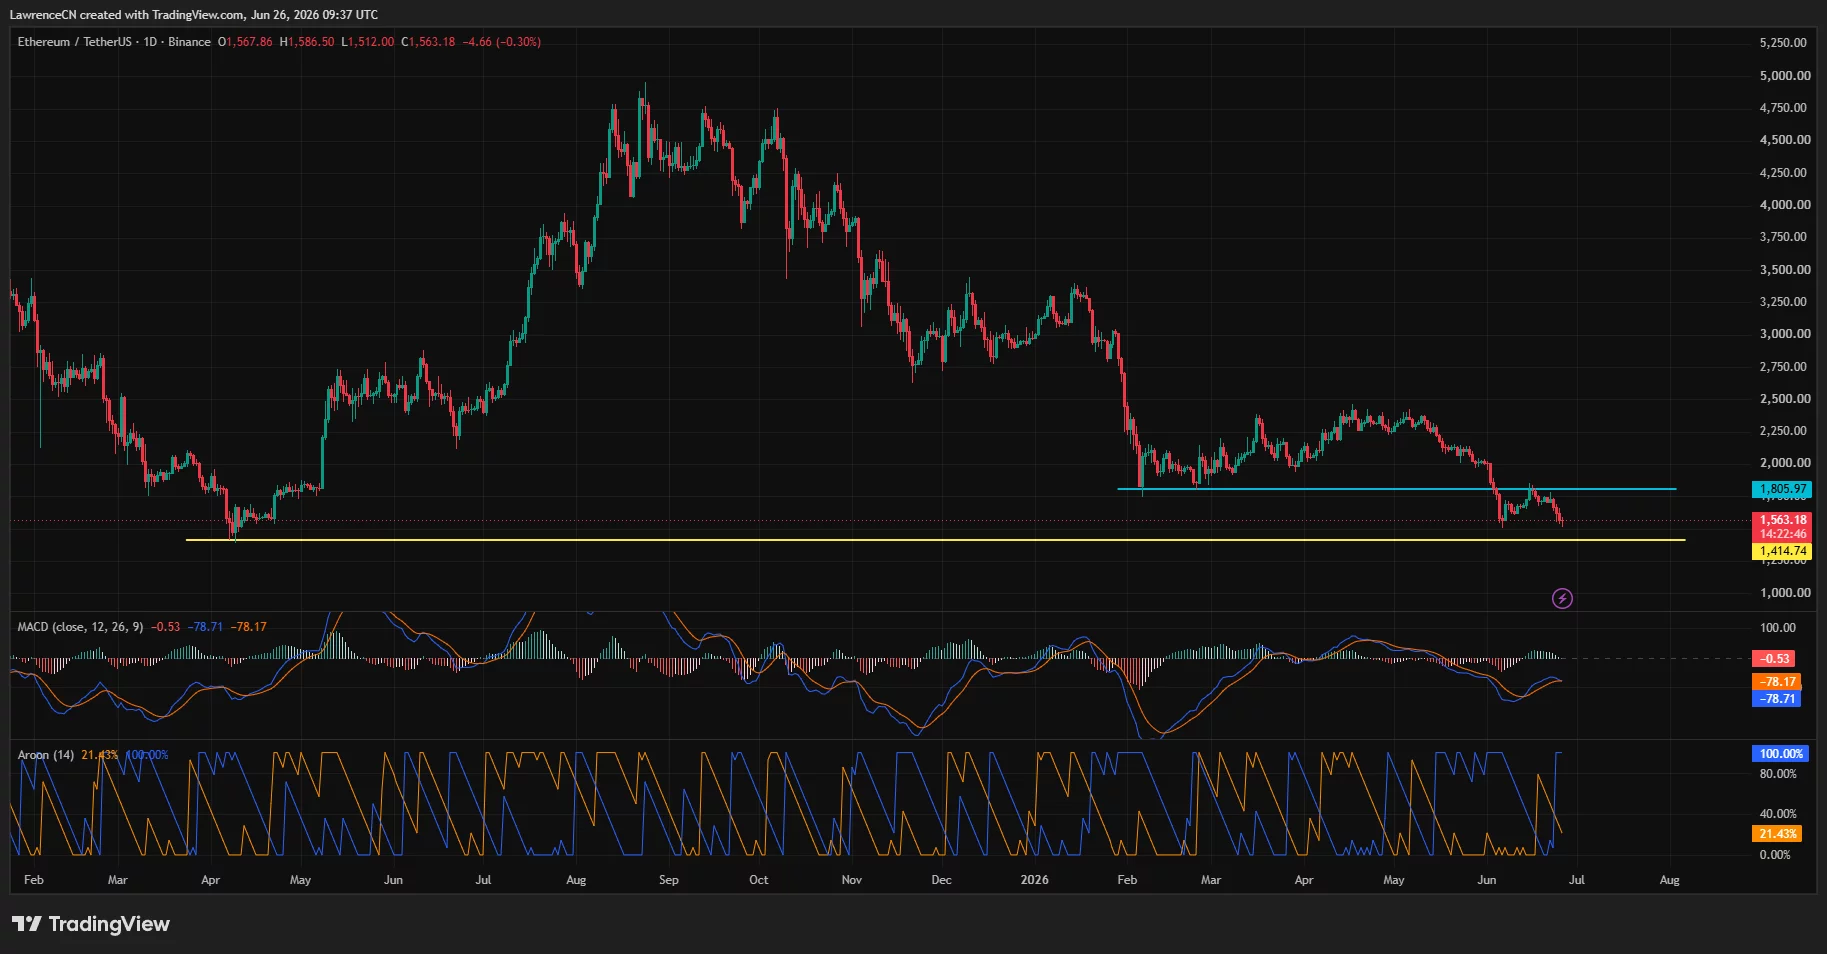
Ethereum’s daily chart shows that the token has broken below the $1,805 support area, turning a former demand zone into overhead resistance. The next major support sits near $1,414, while the current rebound attempt has remained limited after buyers defended the $1,500–$1,520 region.
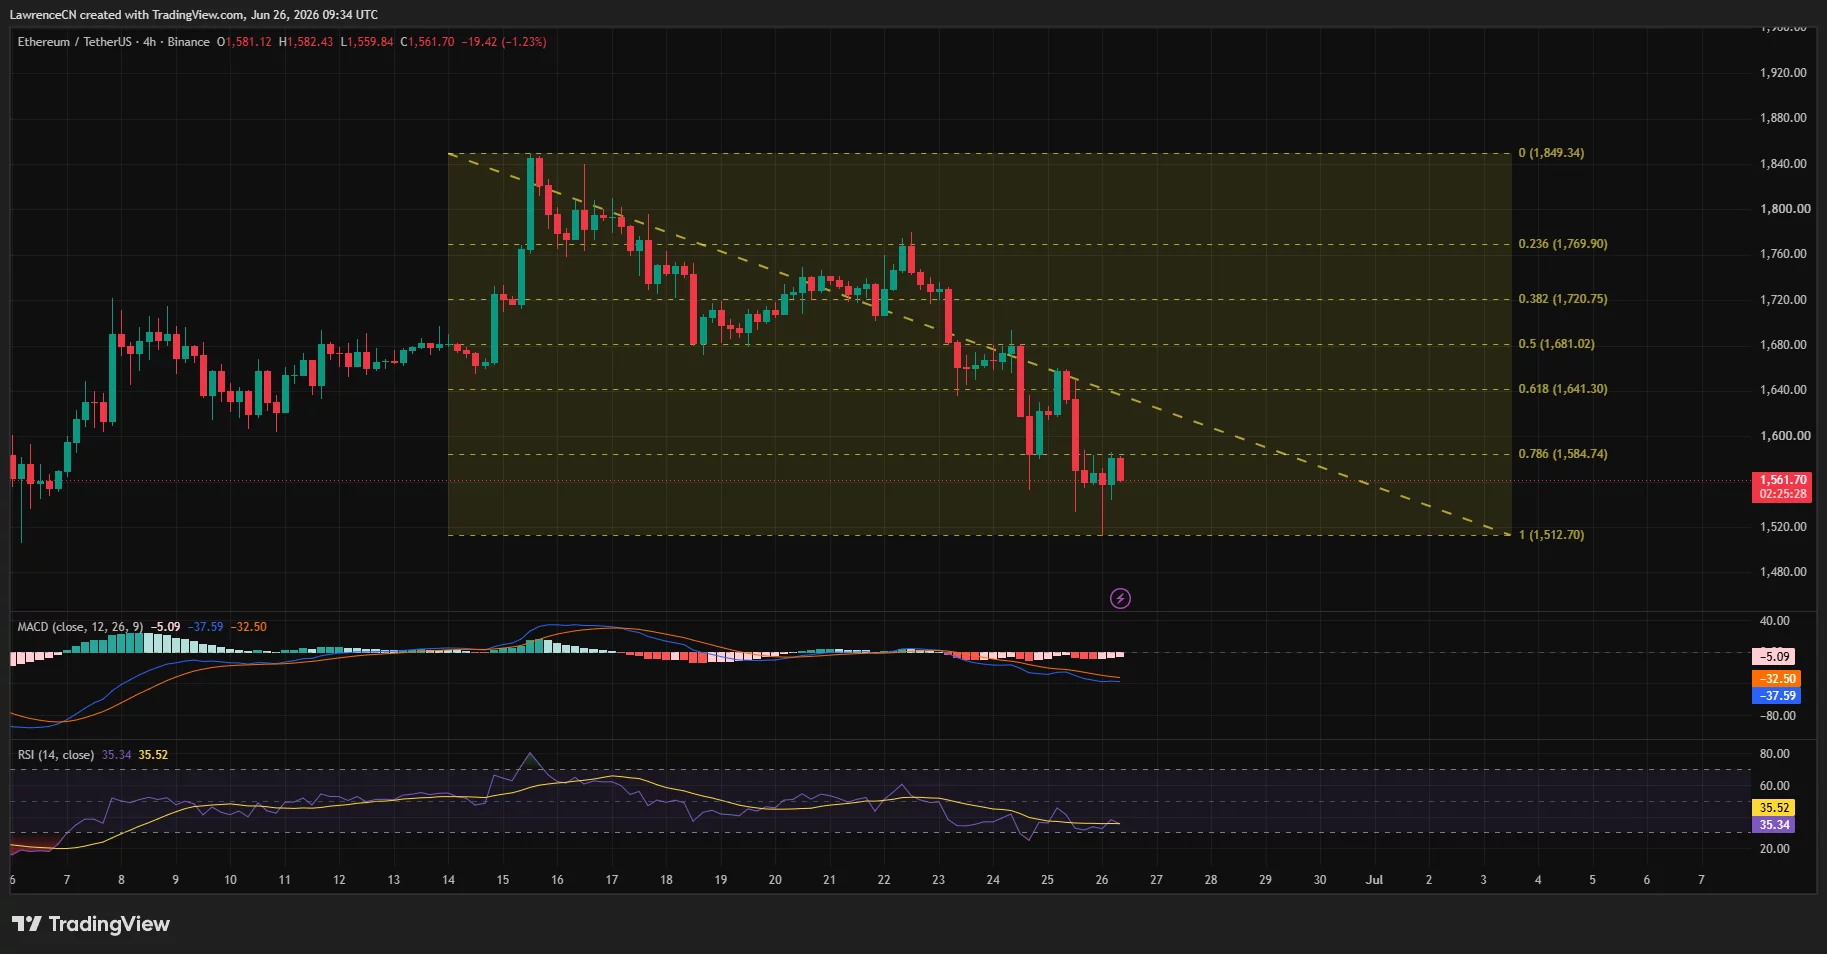
On the four-hour chart, Ethereum has been moving inside a descending channel since its June 15 peak near $1,849. The Fib retracement map places immediate resistance near $1,584, followed by $1,641, $1,681, and $1,720. A stronger recovery would need a clean move above $1,750, which also matches a key level watched by traders.
According to analyst Ted Pillows, Ethereum’s momentum remains weak after retesting the lows.
“ETH tapped the lows again. The momentum is still weak due to market correction. But if Ethereum manages to reclaim the $1,750 level from here, we could see a relief rally next month.”
Momentum indicators remain soft. The four-hour RSI is near 35, keeping Ethereum close to oversold territory without confirming a strong reversal. The MACD remains below the zero line, although its histogram has started to flatten, showing that bearish pressure has slowed after the sharp drop.
The daily Aroon setup still favors sellers. Aroon Down is at 100%, while Aroon Up sits near 21%, showing that Ethereum recently printed fresh lows while upside momentum remains limited. The daily MACD also remains negative, with both signal lines deep below zero.
Liquidation clusters keep pressure on both sides of the trade
CoinGlass’ three-day liquidation heatmap shows heavy leverage around $1,590 to $1,610 and a larger cluster near $1,660. If Ethereum rebounds through those zones, short liquidations could fuel a move toward $1,700 and then $1,750.

Below the spot price, the heatmap shows liquidation interest around $1,520 and $1,500 levels. A break under that area would expose the $1,464–$1,414 region, where the daily chart shows the next major support band.
Whale positioning has also weakened. CryptoQuant analyst Darkfost noted that three large Ethereum holder groups are now underwater, with unrealized profit ratios at -0.26 for 1,000–10,000 ETH holders, -0.21 for 10,000–100,000 ETH holders, and -0.05 for wallets holding more than 100,000 ETH.
According to Darkfost, this condition has not appeared since 2019, as even the largest Ethereum whales stayed in profit during the 2022 bear market. The analyst added that Ethereum has remained “fairly resilient” despite the pressure, as similar whale stress periods have historically appeared near major bottom zones.
Downside risks remain high if Ethereum loses the $1,500 area with volume. A daily close below that level would weaken the double-bottom setup and increase the risk of a deeper move toward $1,414. A hawkish Federal Reserve, stronger U.S. dollar, rising Treasury yields, and continued ETF outflows would add pressure if institutional demand fails to recover.
The bullish invalidation level is now clear. Ethereum needs to reclaim $1,750 and then $1,805 to prove that the latest decline was a liquidity-driven flush rather than the start of another breakdown. Until then, the market remains trapped between forced selling below $1,600 and short-covering risk above $1,660.
Disclosure: This article does not represent investment advice. The content and materials featured on this page are for educational purposes only.