

The latest Bitcoin (BTC) price drop has raised concerns about the cryptocurrency’s upcoming performance, with some analysts warning that BTC’s next key closes could signal the start of another major correction.
Related Reading
Bitcoin Risks Another Major Crash
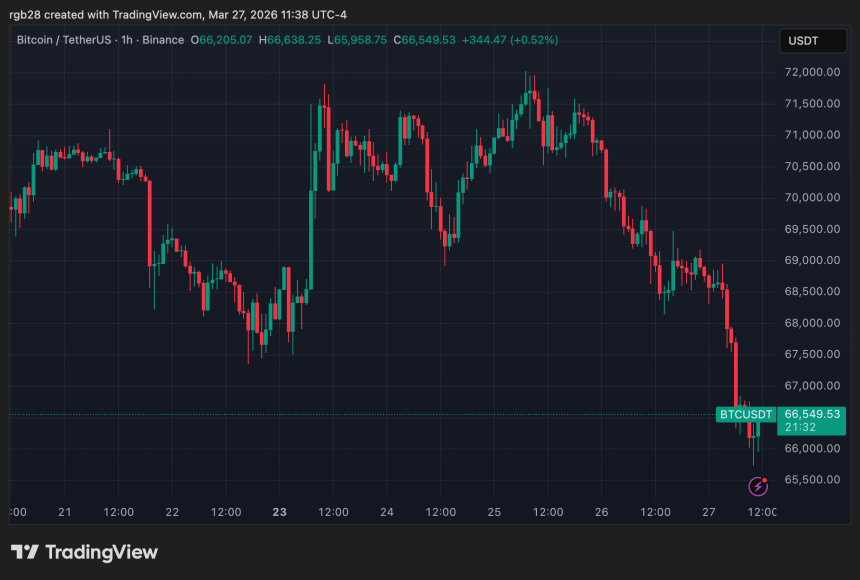
On Friday, Bitcoin plunged over 7% intraday to a three-week low of $65,700, raising concerns about the flagship crypto’s short- to mid-term performance. The cryptocurrency has been trading between the $65,000-$72,000 levels since the early February crash.
After its latest drop, analyst Altcoin Sherpa noted that holding the current levels is crucial, as losing this boundary could quickly send BTC’s price 6%-10% down to the next support area, around $60,000-$62,000.
Several market observers also warned that the cryptocurrency is currently breaking down a crucial bearish formation, which could also trigger a massive crash to newer lows if the price doesn’t bounce soon.
Notably, Bitcoin has been forming a bear flag pattern on the daily timeframe for nearly two months, retesting the formation’s lower boundary on multiple occasions. However, BTC now risks losing this level as support, as it shows multiple concerning signs.
Ted Pillows asserted on X that Bitcoin is not only dropping in price but also losing momentum as it has lost its RSI uptrend. “A major sign of weakness,” he added.
The analyst also emphasized that BTC’s breakdown “is only a matter of when, not if,” cautioning that the flagship cryptocurrency has already broken down of a similar two-month bear flag pattern at the start of the year.
Meanwhile, Ali Martinez suggested that BTC could drop another 30%-45% based on its historical performance over the past decade. As he explained, Bitcoin has kicked off new bull runs after dropping below its long-term holder realized price, and it’s −0.2 standard deviation band, located at the $48,387 and $36,657 levels, respectively.
“I’ll be watching these zones for dip-buying opportunities ahead of the next bull cycle,” he stated.
All Eyes On BTC’s Weekly Close
Analyst Rekt Capital highlighted another concerning sign for Bitcoin, noting that BTC has once again dropped below the 200-week Exponential Moving Average (EMA). Amid this drop, the cryptocurrency is treating this level as resistance once more, putting the focus on the upcoming weekly close.
The analyst previously explained that “If the 200-week EMA is lost as support this week and price Weekly Closes below it again, Bitcoin could actually turn the EMA into new resistance.”
Last week, the largest crypto by market capitalization technically closed below the 200W EMA after attempting to “post-breakout retest” it as support, but failing to end the week above the $68,000 area. “That means that price technically kickstarted a breakdown from the EMA,” and a weekly close below this level would confirm it.
Related Reading
“Given this latest Weekly Close, there is therefore scope for another dip into the 200-week EMA for another retest to see if BTC can solidify a reclaim into support,” he detailed, “But the overall suspicion has become confirmed: The 200-week EMA is acting as both an unreliable resistance and an unreliable support, never truly confirming a clear role.”
The analyst concluded that the indecisiveness could lead to further retests of this area “before ultimately breaking down into additional Macro Downside over time.”
As of this writing, Bitcoin trades at $65,600, a 6% decline in the weekly timeframe.
Featured Image from Unsplash.com, Chart from TradingView.com