

Bitcoin (BTC) reached a monthly high of $79,472 on Wednesday, marking its strongest 28-day return since April 2025. The rally aligns with a shift in a market positioning metric and a surge in leverage use.
A combined view of the market positioning metric and open interest shows new positions are being added, potentially influencing BTC’s push toward new highs.
BTC positioning builds with rising leverage
Bitcoin researcher Axel Adler Jr. said that the Bitcoin positioning index has turned higher, with its 30-day average rising to 4.5 from -10.9 in February. The indicator blends net taker flow direction, open interest trends, funding and the exchange balance into a single metric.
Its steady climb since late March, from 0.4 to current levels, shows a consistent improvement without breaking the price trend.
The growth in open interest confirms the same trend. The 30-day change stands at +14.5%, with 23 of the past 30 sessions closing positive. The rising positioning alongside expanding open interest signals new capital entering derivatives markets.
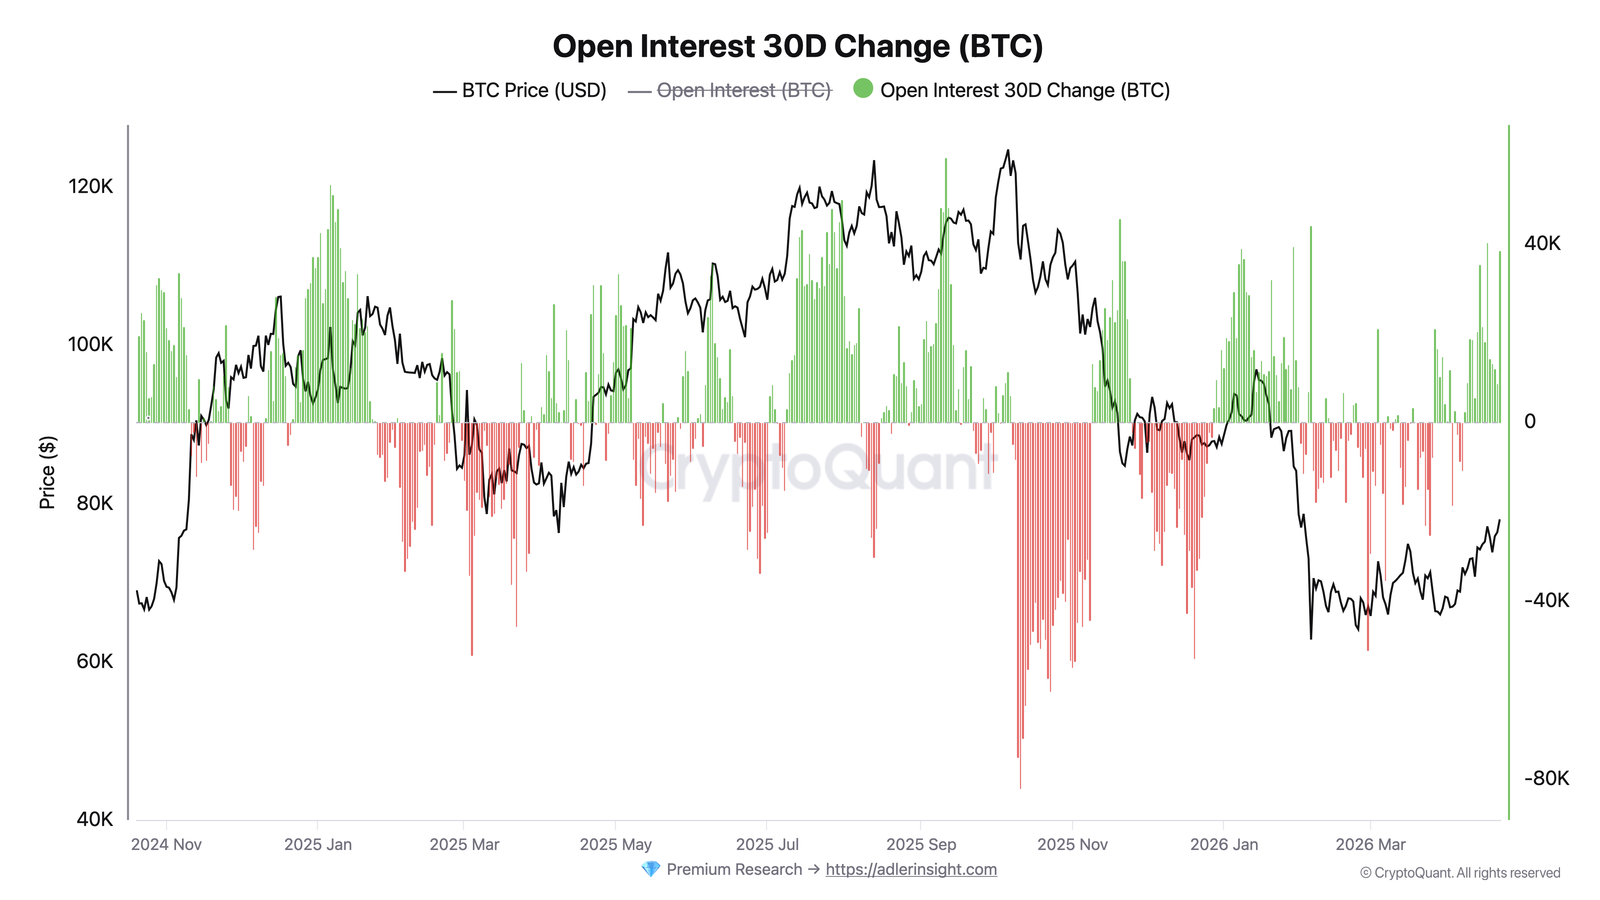
Over the past 24 hours, the aggregated open interest also rose 6.7% to 260,000 BTC, while the price experienced a 10.7% drop in leverage over the weekend.
Related: Bitcoin Bull Score hits six-month high as 2022 bear-market fears linger
Key BTC levels to watch
Bitcoin has moved above a descending trendline dating back to the October 2025 peak near $126,000 and has reclaimed the 100-day exponential moving average (EMA). This indicates a strong shift in trend from bearish to neutral-to-bullish on the higher time frame.
The $81,000 level now serves as the first test area, with a small fair-value gap indicating a liquidity imbalance, where a price hold would signal that buyers are accepting higher prices.
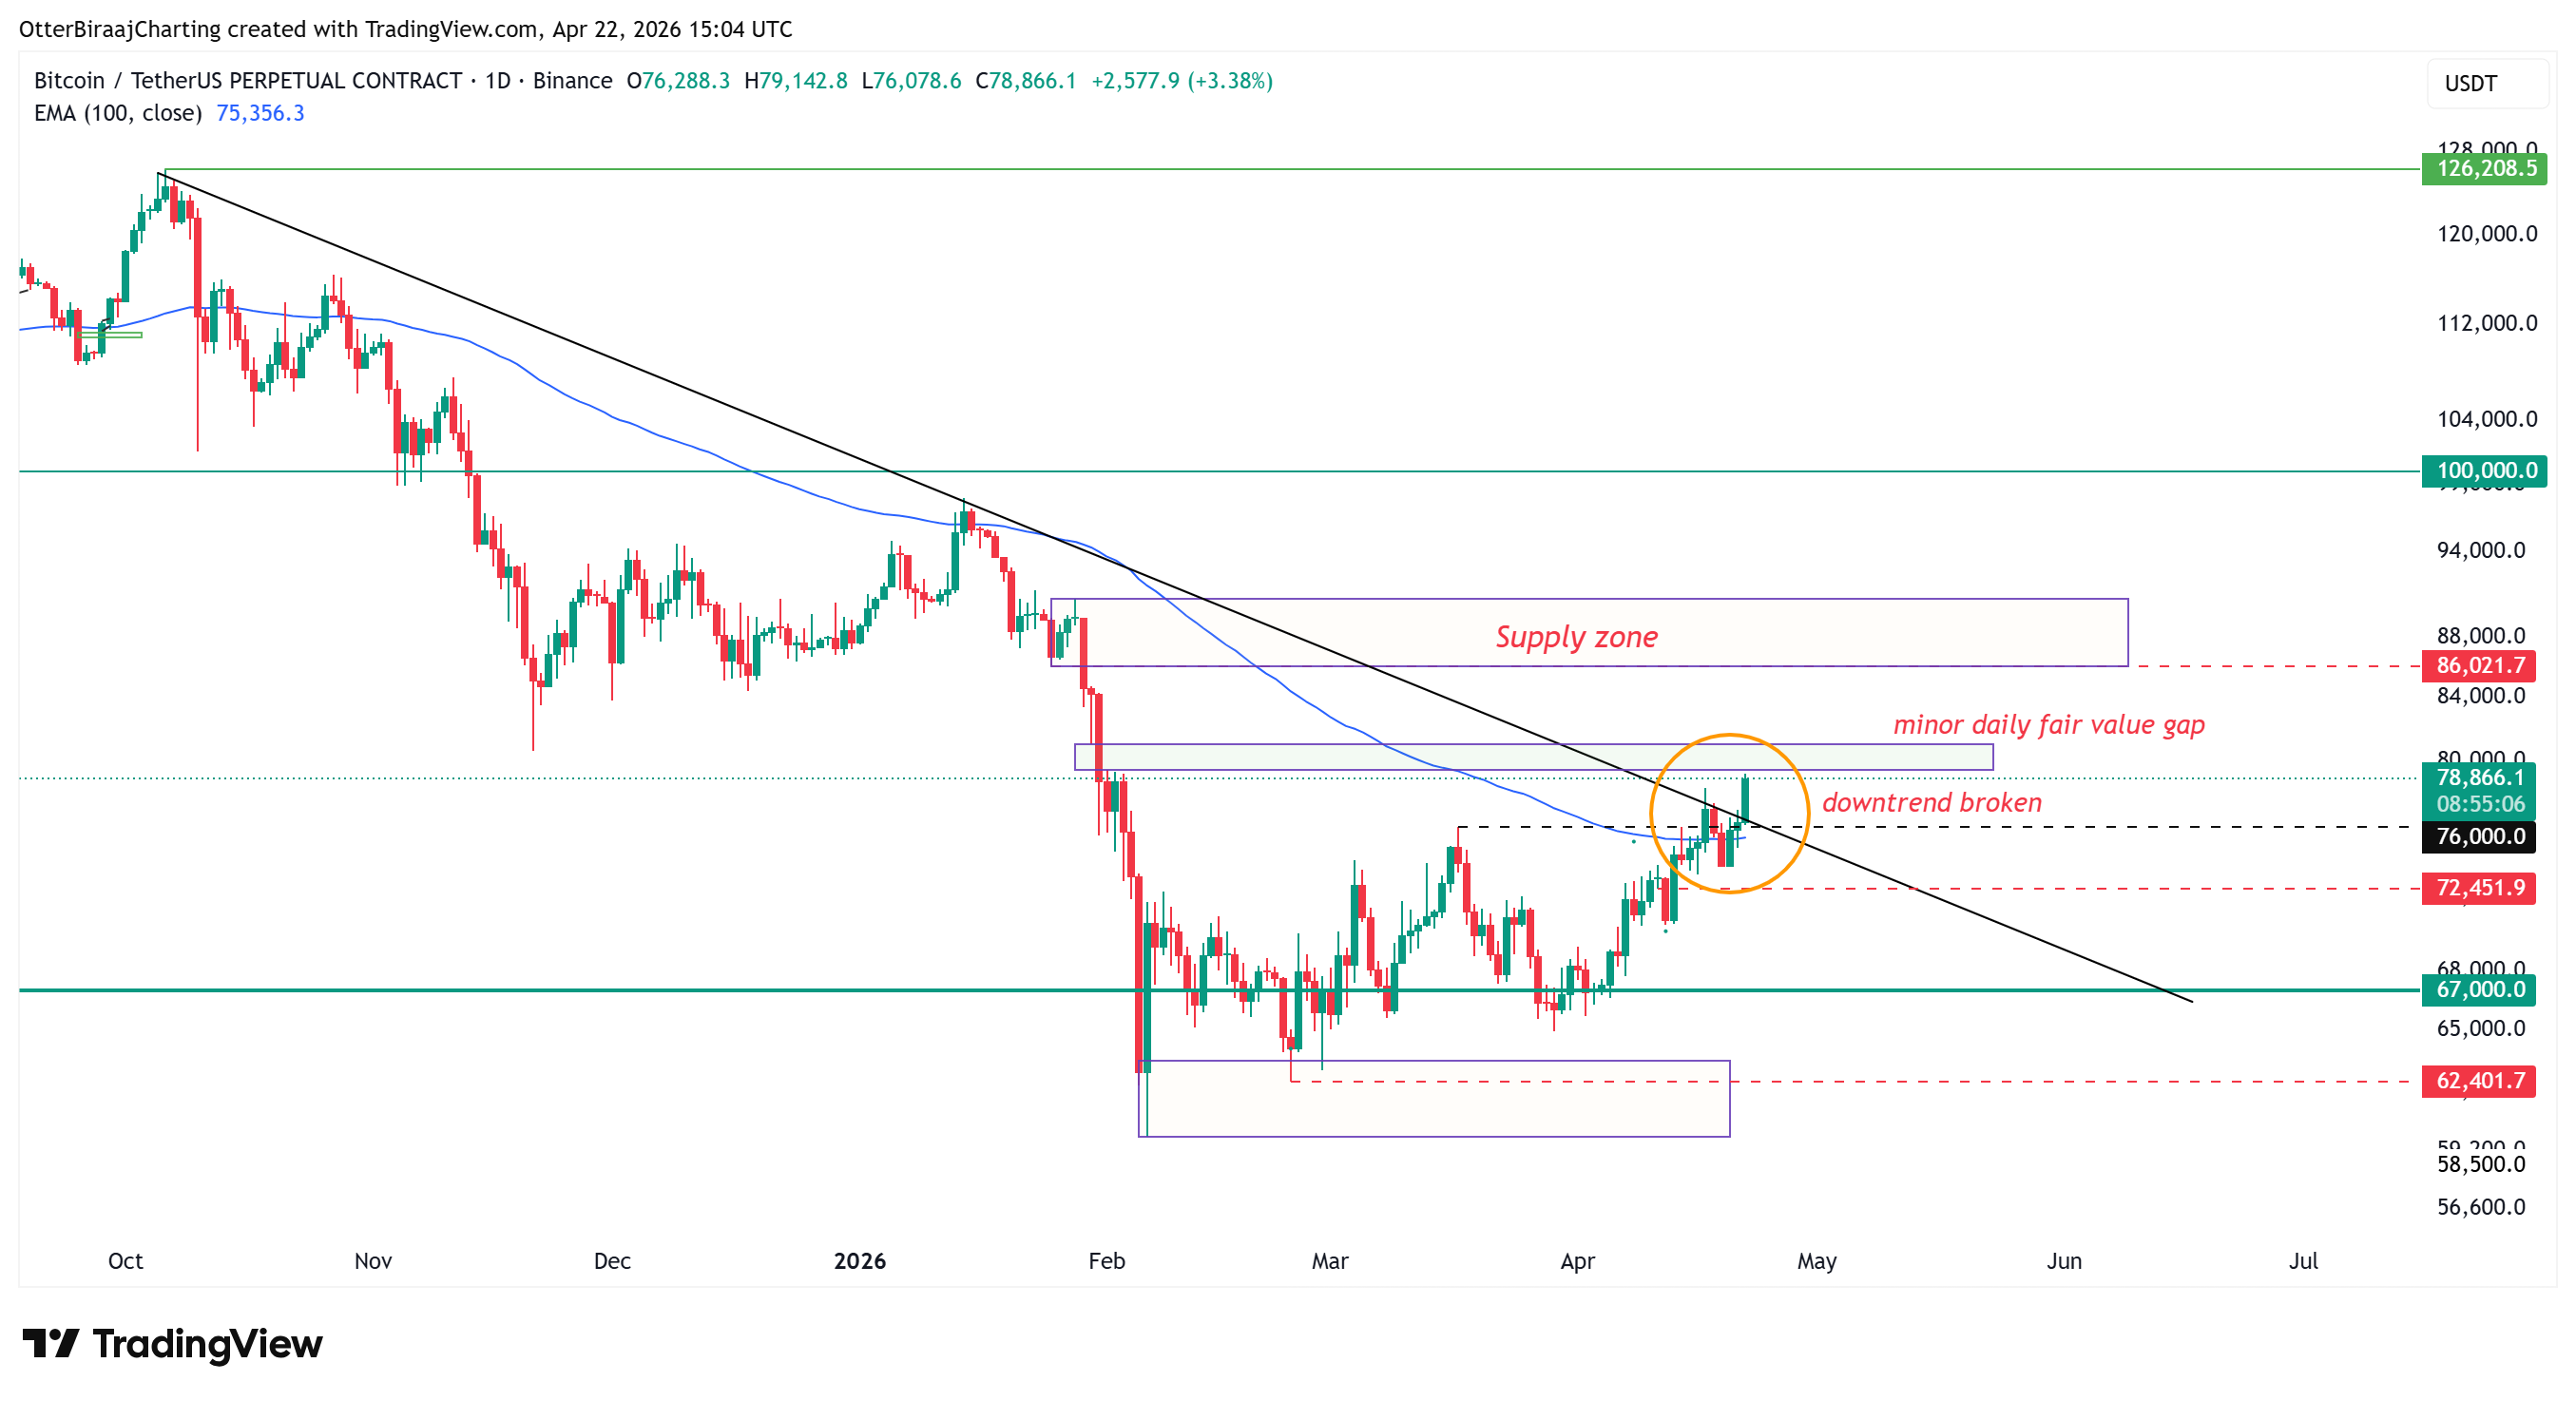
Above that, $88,000 stands as the supply zone tied to prior distribution. The $88,000–$91,000 range stands out as a key supply zone, shaped by a prior distribution phase when large volumes of Bitcoin last changed hands.
Many of those holders are now sitting near break-even or in slight profit, which typically increases activity when the price revisits that area.
Adding to this, the realized price of the three–to-six–month holder cohort sits at $91,600, further reinforcing this zone as a major decision point.
A sustained move through this range would signal strong demand, showing that buyers are absorbing overhead supply and setting the stage for Bitcoin price to move higher.
Crypto analyst Crazzyblockk highlighted a tight range, with the $72,000–$75,000 zone acting as a floor, supported by clusters of realized prices from mid-term holders. A break below this band would push more supply into loss, increasing the risk of reactive selling.
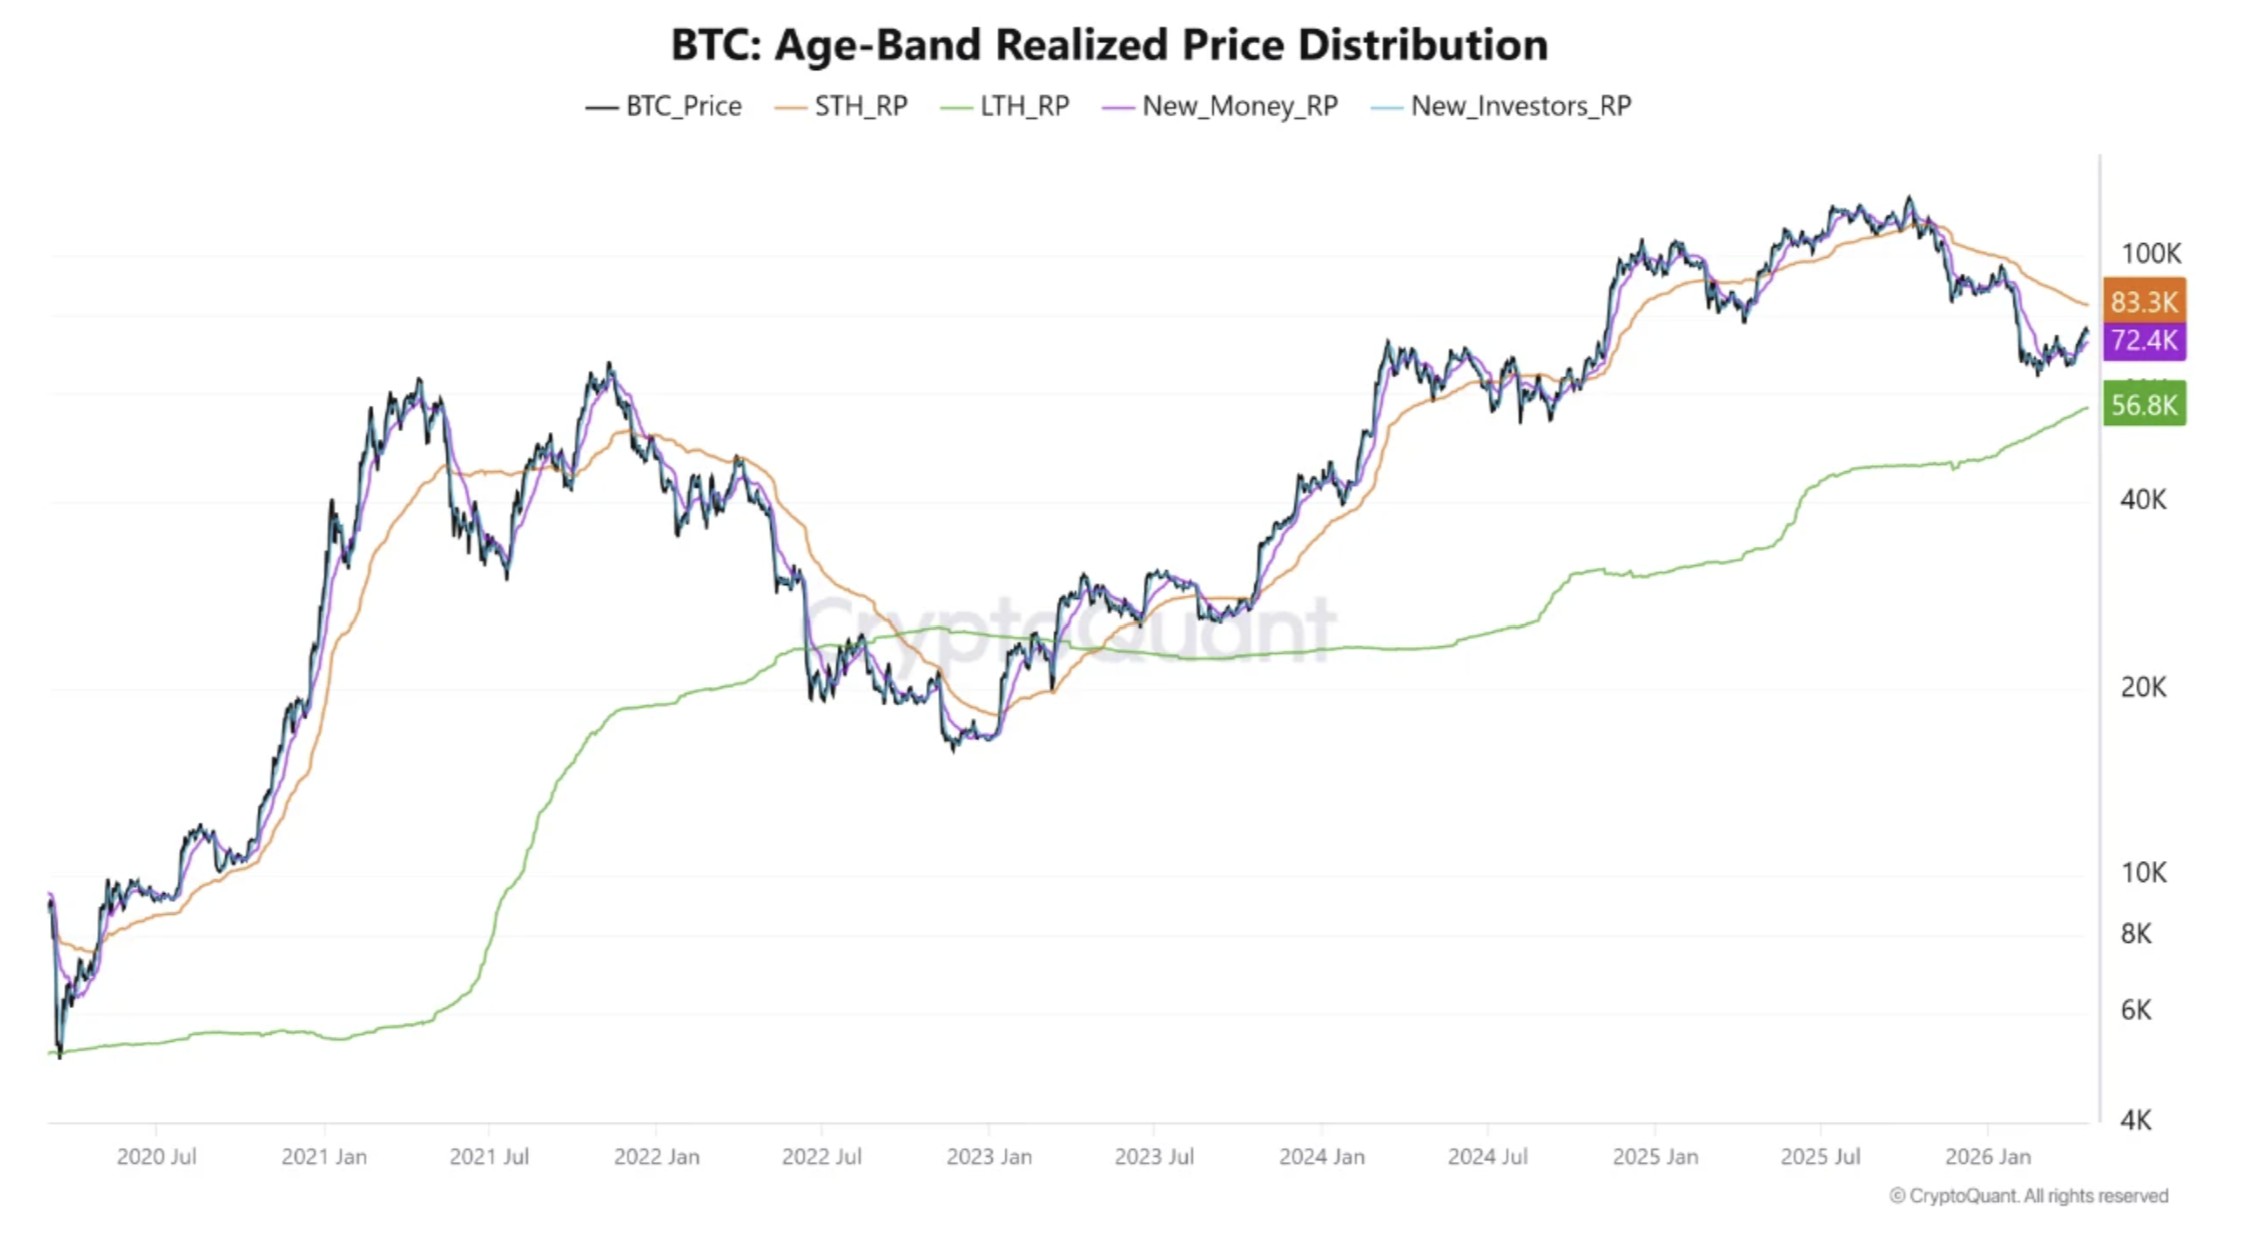
On the upside, the $83,000–$85,000 marks a profit-taking zone for recent short-term holders. Price strength through this range would signal that buyers are absorbing the supply, allowing momentum to build.
Related: ‘Powerful move’ looms for Bitcoin price, says Bollinger Bands indicator
This article is produced in accordance with Cointelegraph’s Editorial Policy and is intended for informational purposes only. It does not constitute investment advice or recommendations. All investments and trades carry risk; readers are encouraged to conduct independent research before making any decisions. Cointelegraph makes no guarantees regarding the accuracy or completeness of the information presented, including forward-looking statements, and will not be liable for any loss or damage arising from reliance on this content.