

Ethereum is struggling to reclaim the $2,000 level, with persistent selling pressure continuing to weigh on sentiment across the broader crypto market. Despite intermittent recovery attempts, price action remains fragile as liquidity conditions tighten and investors reassess risk exposure following the sharp correction from the 2025 highs. The repeated failure to secure sustained acceptance above this psychological threshold has reinforced caution among both institutional and retail participants.
Related Reading
Recent on-chain analysis highlights a notable structural development: Ethereum is currently trading below the realized price of every major whale cohort. The realized price metric represents the average acquisition cost of coins held by a given group, effectively serving as a proxy for aggregate cost basis. When the rice falls below this level, it implies that even large, historically resilient holders are sitting on unrealized losses.
Historically, such conditions tend to coincide with late-stage corrective phases rather than early bull expansions. The last comparable occurrence followed Ethereum’s previous all-time high cycle, specifically in September 2018. That period marked a prolonged consolidation phase during which market excesses were gradually absorbed before a new structural uptrend eventually emerged.
Ethereum Trades Below Whale Cost Basis
Trading below whale realized prices also has psychological implications. Large holders typically operate with longer investment horizons, and their profitability cushions often help stabilize markets during corrections. When that cushion disappears, volatility can increase as confidence weakens and liquidity becomes more reactive to macro catalysts.
This does not necessarily imply immediate bullish reversal conditions. Rather, it signals that the market may be undergoing a redistribution phase in which weaker hands exit while longer-term investors reassess positioning. Markets often require extended stabilization periods after leverage unwinds and sentiment deteriorates, particularly following euphoric cycles.
Related Reading
At the same time, such environments sometimes attract strategic accumulation. Investors willing to tolerate volatility may view sub-realized-price conditions as opportunities, particularly when accompanied by declining leverage and cooling speculative activity. Whether this dynamic ultimately leads to accumulation or further downside depends heavily on macro liquidity trends, regulatory developments, and broader risk appetite across financial markets.
Technical Price Outlook
From a technical perspective, the weekly chart underscores Ethereum’s current vulnerability. Price has recently broken below key moving averages that previously functioned as dynamic support. These averages now act as resistance zones, limiting upside momentum unless decisively reclaimed. The recent decline toward the $1,900–$2,000 region reflects a continuation of the broader corrective structure that began after the mid-2025 peak.
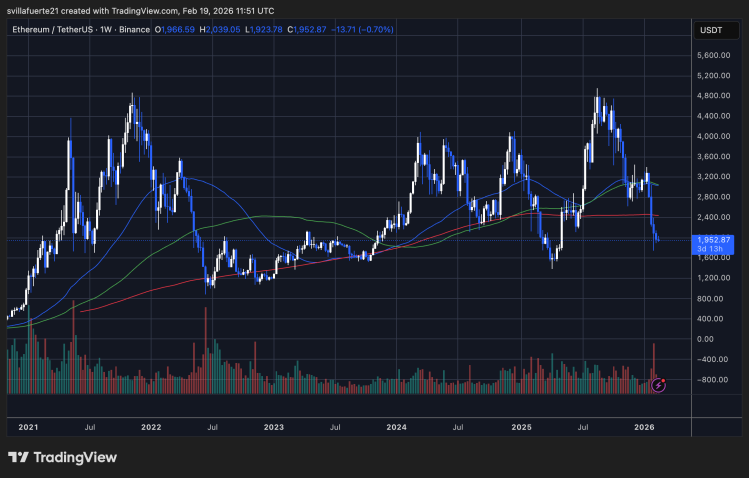
Volume patterns suggest participation has moderated compared with the impulsive rally phase, indicating reduced speculative enthusiasm. However, declining volume during corrections can also signal exhaustion of aggressive sellers, potentially setting the stage for base formation if demand stabilizes.
Related Reading
Immediate support appears concentrated near the recent local lows around the mid-$1,800 zone, while resistance remains clustered near the $2,200–$2,400 region where prior consolidation occurred. A sustained move above these levels would be required to shift short-term momentum decisively positive. Conversely, failure to hold current support could expose Ethereum to deeper retracement levels consistent with broader market deleveraging.
For now, Ethereum remains at a technical and psychological crossroads. Trading below whale realized prices, struggling beneath major resistance levels, and navigating uncertain macro conditions collectively define a market still searching for equilibrium rather than entering a confirmed recovery phase.
Featured image from ChatGPT, chart from TradingView.com