

On February 6, the price of the leading cryptocurrency fell to $60,000, the lowest since September 2024. It later partially recovered to the $65,000–66,000 range.
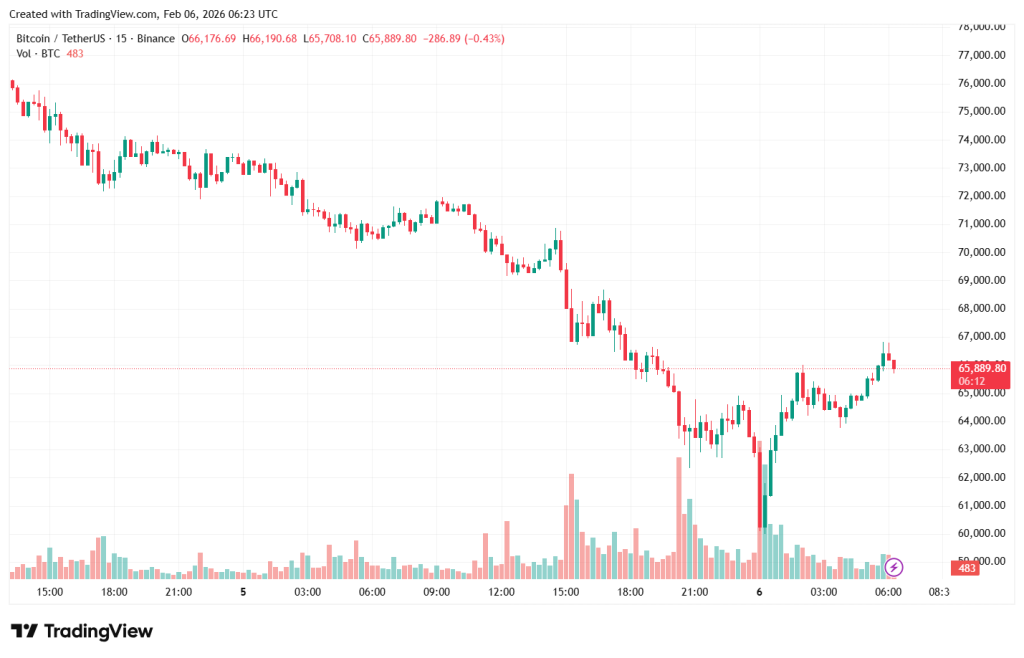 15-minute BTC ($64,879.00 · Live)/USDT ($1.00 · Live) chart on Binance. Source: TradingVIew.
At the time of writing, bitcoin is trading at $65,889 (-6.6% over 24 hours).
Altcoins fell in bitcoin’s wake: Ethereum briefly dipped to $1,756, Solana to $70 and BNB ($620.09 · Live) to $574. Total market capitalisation declined by 6.1% to $2.3 trillion.
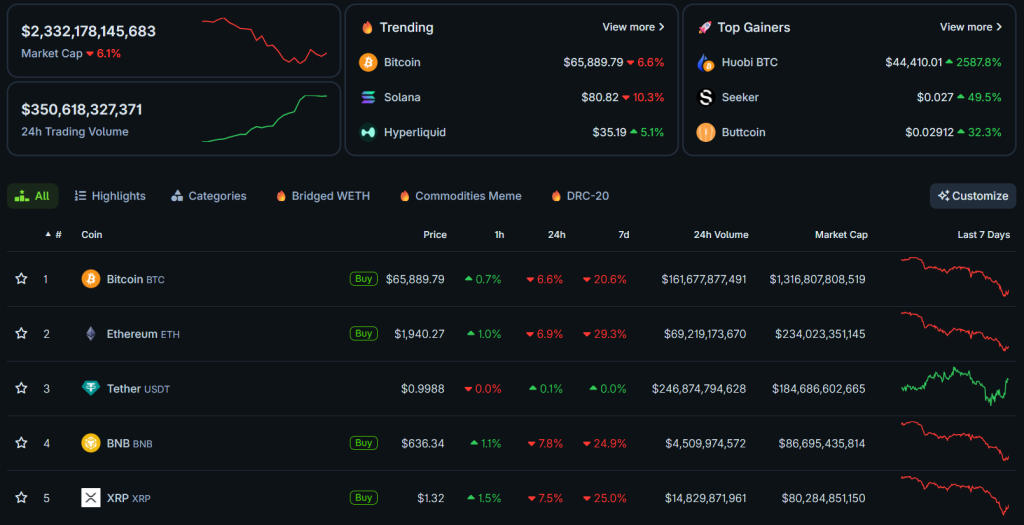 Source: CoinGecko.
The sharp decline triggered a cascade of liquidations. According to CoinGlass, 24-hour forced closures reached $2.59 billion. Long positions bore the brunt — $2.11 billion.
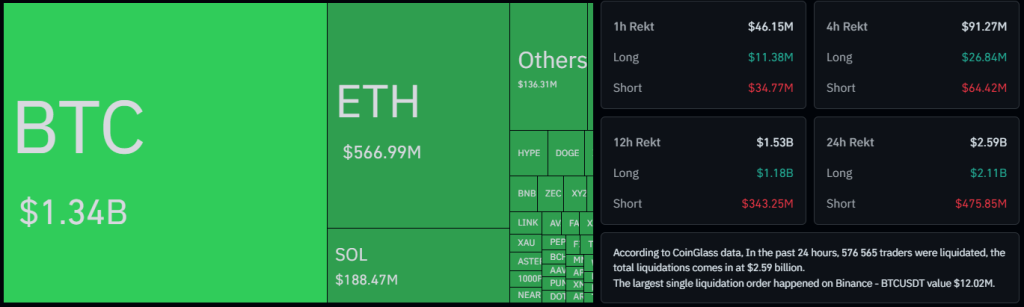 Source: CoinGlass.
A popular sentiment indicator plunged to 9 (“extreme fear”) — the lowest reading since the metric launched in mid-2023.
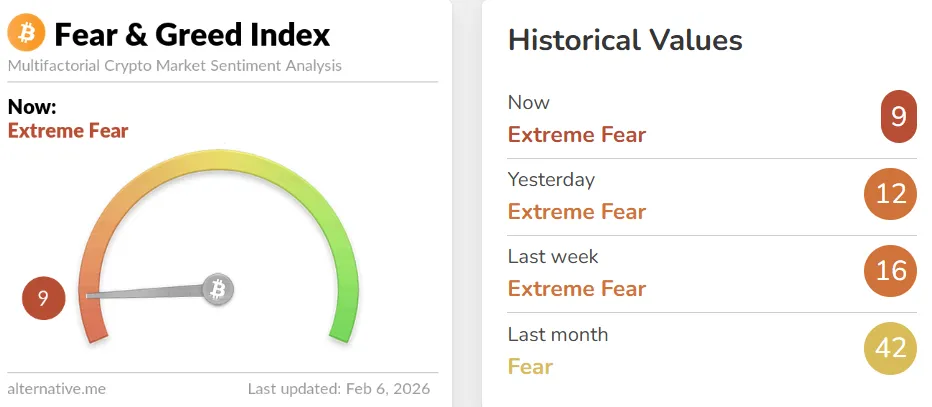 Crypto Fear & Greed Index. Source: Alternative.
A perfect storm
Kronos Research’s chief investment officer, Vincent Liu, called the rout “a perfect storm”. He said three forces coincided:
- liquidations of highly leveraged positions;
- capital outflows from ETFs and institutional funds;
- risk-off positioning amid the macroeconomic backdrop.
“This is a classic deleveraging: aggressive and rapid, emotionally driven selling. Bitcoin’s capitulation metric showed the second-strongest spike in two years,” Liu noted.
He believes bitcoin needs to hold the $58,000–60,000 range and await a stabilisation in fundamentals for a recovery to start.
BTC Markets analyst Rachel Lucas added that traders have shifted to capital preservation and stopped buying the dip.
Institutions and ETFs
Spot bitcoin ETFs are seeing outflows: on February 3 and 4, the funds lost more than $900 million.
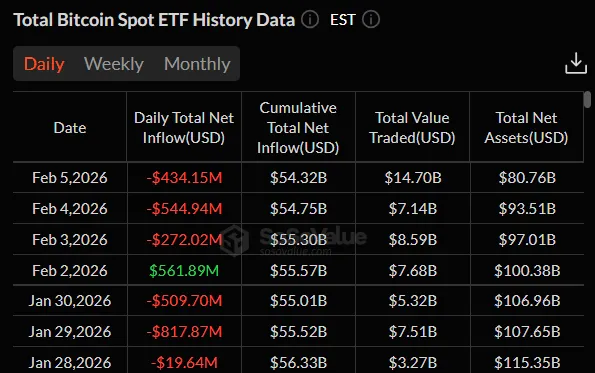 Source: SoSoValue.
Trading activity remains elevated, however: volume in BlackRock’s IBIT hit a record $10 billion as its price fell 13%, said Bloomberg senior analyst Eric Balchunas.
$IBIT just crushed its daily volume record with $10b worth of shares traded as its price fell 13%, second worst daily price drop since it launched. Brutal. pic.twitter.com/HxMDl9fxbW
— Eric Balchunas (@EricBalchunas) February 5, 2026
CryptoQuant experts warned of “broad structural weakness” in the market. Institutional demand has reversed sharply, and the Bull Score has fallen to zero. Technical indicators confirm a bearish trend: for the first time since March 2022, bitcoin has settled below its 365-day moving average.
Analysts noted that the current support area at $60,000–70,000 coincides with the estimated cost of mining coins ($65,000–70,000).
A signal for a rebound?
Despite the gloom, some on-chain indicators show buyer interest. Analyst Darkfost observed rising inflows of stablecoins to exchanges.
Stablecoin Inflows Double Despite Persistent Selling Pressure
“Positive signal, as it shows that investor interest is gradually returning at this level of correction.” – By @Darkfost_Coc
Read the complete analysis ⤵️https://t.co/meVXiwiKRX pic.twitter.com/JUALrZNGXE
— CryptoQuant.com (@cryptoquant_com) February 6, 2026
At the end of December, the average weekly volume of deposits was $51 billion. It has now reached $98 billion, surpassing the 90-day moving average ($89 billion).
In his view, this points to capital reactivation: investors have started buying the dip, though selling pressure remains too strong to fully absorb supply.
Darkfost noted that bitcoin is gradually nearing the 50% retracement level from the October high.
“This is a positive signal. Market participants’ interest is gradually returning at current price levels,” the analyst concluded.
On February 3, K33 Research analyst Vetle Lunde ruled out the prospect of an 80% price crash. Later, technical analyst Peter Brandt called the decline in the first cryptocurrency “a planned campaign” by big players.