

Bitcoin is finding near-term relief after a sharp rebound toward the $70,000 level, offering temporary optimism following weeks of sustained pressure. The move has improved short-term momentum and eased immediate downside risk. However, the broader market remains characterized by indecision, as many analysts argue that this advance may represent a relief rally within a larger corrective structure rather than the start of a renewed bull phase.
Related Reading
According to analysis from XWIN Research Japan, while price has recovered meaningfully from recent lows, underlying derivatives data suggest caution. Open Interest has fallen significantly from prior cycle highs, reflecting an extensive deleveraging process across futures markets. Importantly, the recent price decline occurred alongside contracting Open Interest, indicating that forced liquidations and derivatives-driven position unwinds were primary drivers of the selloff rather than sustained spot distribution.
Such resets can be constructive, as they reduce excessive leverage and stabilize funding conditions. Nonetheless, a cleaner derivatives landscape does not automatically translate into fresh structural demand. Without clear evidence of renewed capital inflows or expanding spot participation, the current rebound may remain vulnerable to renewed volatility.
Muted Exchange Flows Suggest Stabilization, Not Yet Structural Strength
Recent exchange flow data adds nuance to Bitcoin’s current recovery phase. Binance’s Fund Flow Ratio remains subdued near 0.012, indicating that inflows relative to total BTC reserves on the platform are limited. In practical terms, this suggests that immediate sell-side pressure has not intensified, even during the recent move toward the mid-$60K region. The absence of a spike in this metric implies that investors are not rushing to transfer coins to exchanges in panic, which typically accompanies more aggressive distribution phases.
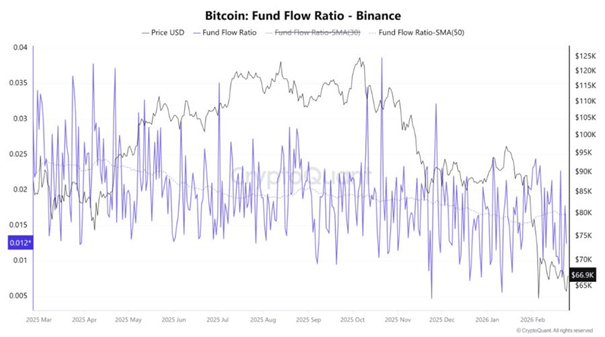
However, low inflows should not automatically be interpreted as accumulation. The medium-term trend in the ratio’s moving averages continues to drift downward, indicating that sustained structural demand has yet to reassert itself. Markets can stabilize without transitioning directly into expansion, particularly when liquidity conditions remain cautious.
Additional context from derivatives positioning reinforces this ambiguity. With leverage still relatively compressed, upward price movements can disproportionately trigger short liquidations, generating rallies driven more by position unwinds than fresh capital deployment. This type of rebound often improves sentiment temporarily but may lack durability without stronger spot participation.
Overall, Bitcoin appears to be transitioning from active selling toward stabilization. Confirmation of a genuine bullish reversal will likely require consistent inflows, improving liquidity, and clearer evidence of renewed investor demand.
Related Reading
Bitcoin Tests Support After Sharp Correction
Bitcoin remains under pressure following a pronounced correction from its recent highs, with price currently stabilizing near the $68,000 region. The weekly structure shows a clear loss of upward momentum after rejection around the $110K–$120K zone, followed by a decisive breakdown below the 50-week and 100-week moving averages. This shift typically signals weakening intermediate trend strength rather than simple short-term volatility.
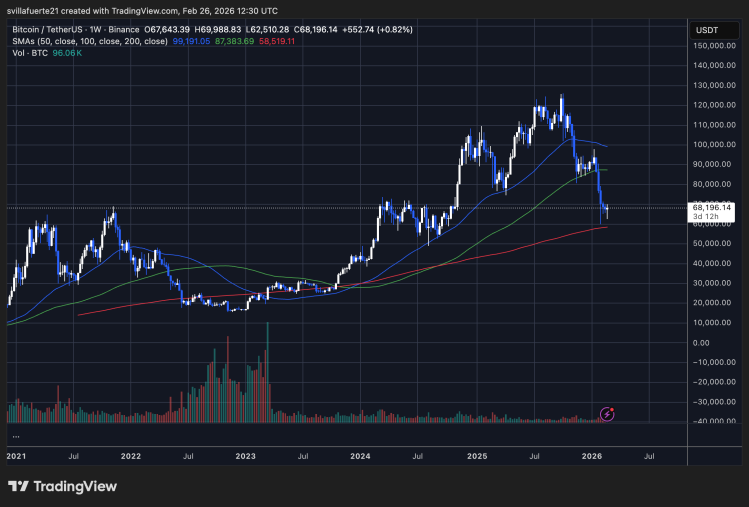
Price is now hovering close to the 200-week moving average, historically a critical structural support during transitional market phases. Holding this level could help stabilize sentiment and potentially define a medium-term floor. However, a sustained breakdown below it would likely increase downside risk, as it would confirm deterioration in long-term trend structure.
Related Reading
Volume dynamics also warrant attention. The recent selloff occurred with elevated activity compared with preceding consolidation phases, suggesting that distribution — not merely thin liquidity — contributed to the decline. That said, volume has started to moderate as price consolidates, indicating reduced urgency among sellers.
Bitcoin appears to be transitioning into a defensive consolidation phase. Recovery above the shorter moving averages would be required to restore bullish momentum, while failure to hold current support could extend the corrective cycle further.
Featured image from ChatGPT, chart from TradingView.com