

As Bitcoin (BTC) attempts to reclaim a crucial level as support, spot exchange-traded funds (ETFs) based on the flagship cryptocurrency have registered their best performance since the October market crash.
Related Reading
Bitcoin ETFs ‘Back In The High Life’
US spot Bitcoin ETFs extended their positive streak to eight days after pulling in $223.2 million on Thursday, signaling strong demand for the investment products as the crypto market recovers.
The BTC-based funds have been consistently seeing positive net flows since April 14, recording $2.09 billion in inflows during this period, according to SoSoValue data.
This marks the category’s strongest performance across multiple timeframes since its late September-early October nine-day streak, when the products saw roughly $5.33 billion in inflows.
In the weekly and monthly timeframes, Bitcoin ETFs are currently recording their best performance of 2026, tying March’s four-week streak but nearly doubling the monthly inflows, with $2.43 billion in April so far and four more days to go.
Market observer Sjuul from AltCryptoGems asserted that sustained institutional demand is building again, highlighting that the products are about to close their second green month of 2026, and the first two-month streak since October 2025.
Similarly, Bloomberg Senior ETF analyst Erich Balchunas affirmed that Bitcoin ETF flows are “back in the high life” as every single tracking period turns positive and cumulative net inflows hit $58.33 billion.
“Every single rolling period we track is now positive, haven’t seen that in months (IBIT’s $3b is in Top 1% of all ETFs). Still tho, need a couple bil more to get back to breaking new ground in cumulative lifetime flows (62.8b),” he wrote on X.
All Eyes On BTC’s Weekly Close
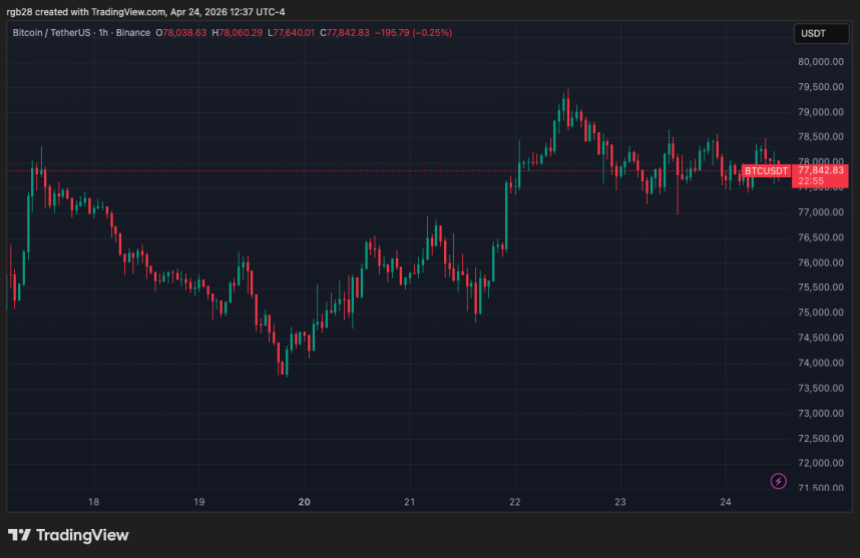
Bitcoin ETFs’ performance comes as the flagship cryptocurrency continues to reject from a key resistance area. In a recent analysis, Rekt Capital said that while BTC’s price enjoys upside momentum, the key levels haven’t changed yet.
Notably, BTC’s 21-week Exponential Moving Average (EMA), located around $78,000, remains an important resistance level as the cryptocurrency has been unable to reclaim it on the weekly timeframe.
“If BTC Weekly Closes above the 21-week EMA, then it would be worth watching for whether the EMA can be reclaimed as support,” the analyst affirmed, adding that level tends to serve as resistance in bear markets.
On the contrary, if BTC is unable to reclaim this level as support, it could push BTC’s price into a post-breakout retest of its Double Bottom pattern. Last week, Rekt Capital highlighted that Bitcoin had broken out of a Double Bottom formation, which could lead to a measured move toward the $81,000-$82,500 area.
Related Reading
Now, he has asserted that the “Double Bottom formation top could always become a post-breakout retesting zone in the event of rejection from the EMA.” In addition, he emphasized that BTC remains below the base of the macro triangle formation it broke down from in late January.
Historically, Bitcoin has not been able to reclaim a macro triangle during a bear market once the price breaks down. If this trend continues, the analyst warned, then the flagship crypto could see limited additional upside toward the pattern’s base before resuming its correction toward the market bottom.
Featured Image from Unsplash.com, Chart from TradingView.com